Time-aware evaluation
The last 48 hours are held out; the model is fit only on preceding observations instead of using a random split that leaks future information.
02 / MACHINE LEARNING / TIME SERIES
A time-series forecasting experiment using historical U.S. electricity demand, with a comparison against a simple baseline.
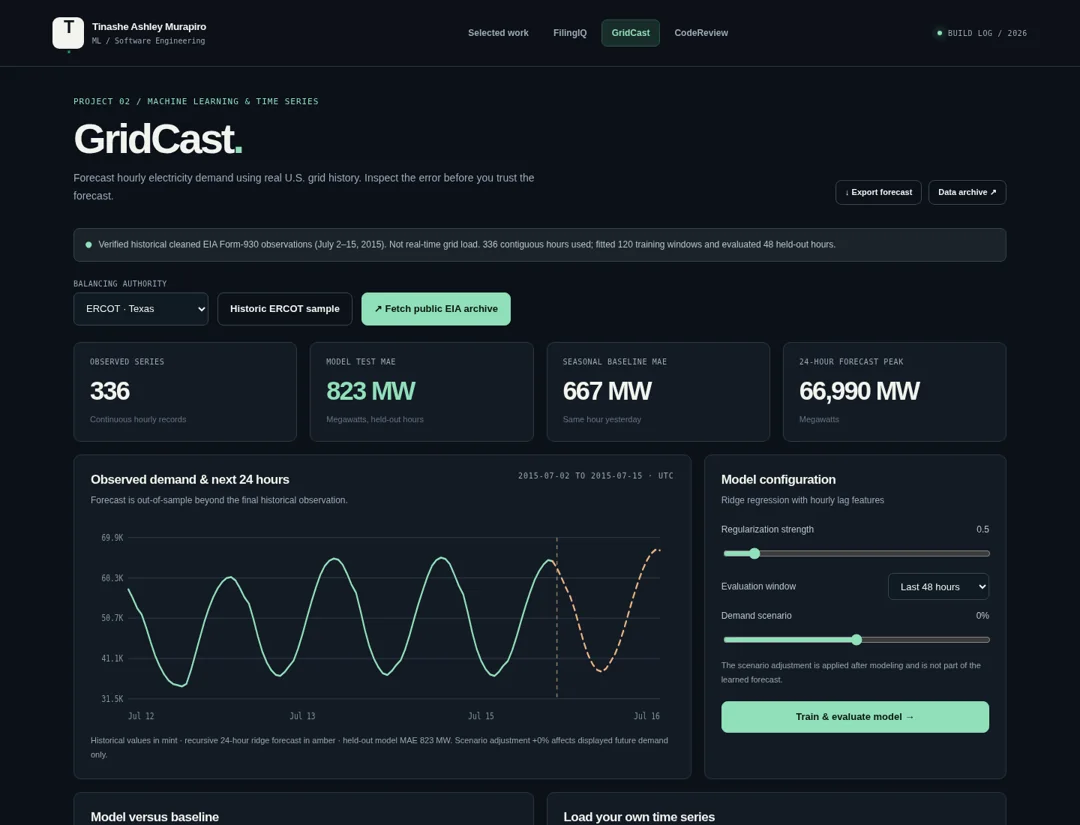 APPLICATION CAPTURE / LOCAL TESTING
01 / THE PROBLEM
A forecast chart can look convincing even when the model does not beat a simple alternative. This project tests performance on observations held out from training.
GridCast uses hourly demand and lag features, keeps the final 48 hours out of training, and compares ridge regression with a forecast based on demand at the same hour the previous day.
02 / FEATURES
Explore 336 consecutive historical ERCOT hourly demand observations
Fit browser-side ridge regression using lagged demand and calendar features
Compare MAE against a 24-hour seasonal-naive baseline on held-out observations
Adjust forecast scenarios and inspect future 24-hour estimates
Import another valid hourly CSV or load supported public historical archive data
03 / IMPLEMENTATION
The last 48 hours are held out; the model is fit only on preceding observations instead of using a random split that leaks future information.
The naive forecast is evaluated alongside ridge regression. In the included reference experiment, the simple baseline performs better.
The displayed uncertainty envelope is a heuristic derived from validation error, not a calibrated probabilistic interval.
04 / TESTING & LIMITATIONS
336 consecutive ERCOT demand observations from July 2–15, 2015. Independent Python backtest: ridge MAE 823.37 MW; 24-hour seasonal baseline MAE 667.42 MW on the 48-hour holdout. *667 MW is the baseline, not the trained model.
Fourteen days of 2015 data are insufficient to establish robust modern grid forecasting. The reference report uses observed lags for one-step-ahead evaluation; the forward 24-hour projection is recursive. No real-time operational claims.
05 / DATA SOURCES